If you have a setup of an AWS infrastructure for your web platform. Then you’ve probably noticed some performance issues that might differ from older times where you see an increase over the days, or maybe you have multiple regions and you’re wondering why some regions are better than others.
In this case, try to look at what you’re load balancer is receiving, detecting, delegating, and responding to understand where’s the hiccup happening. (of course, we’re assuming that you’ve already checked the code for performance issues first).
This is going to be a very actionable blog. Step by step to gain access to the logs.
How to enable the logs
- Enable your ALB’s access log, or any other load balancer setup you’re using in AWS
- Make sure the logs are being sent to S3
- Now go to Athena (An interactive query service that makes it easy to analyze data in Amazon S3 using standard SQL)
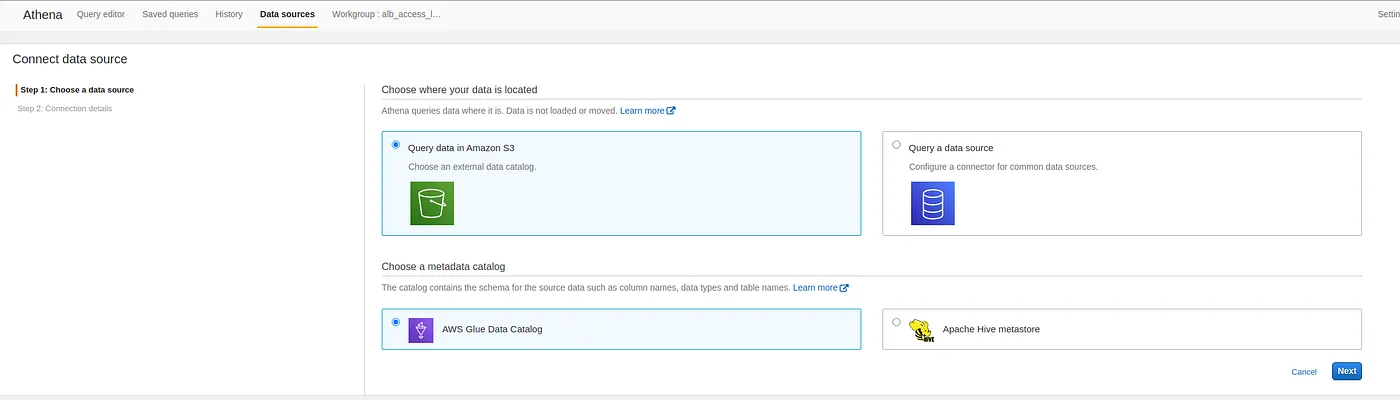
- Click Connect data source in Athena, which will give you something like this:
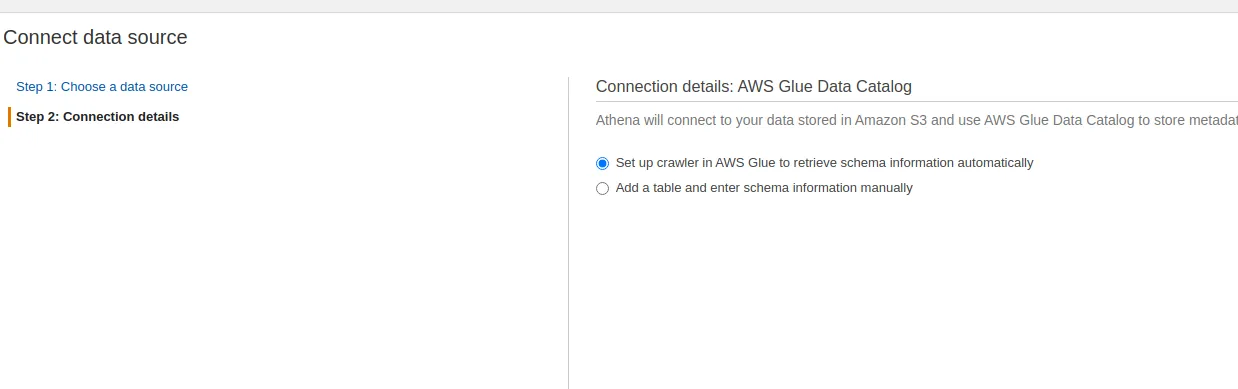
- Now on the next page, either you use Glue to retrieve your log schema from the s3 access log files, or you get the schema from the link below and add it yourself Querying Application Load Balancer Logs An Application Load Balancer is a load balancing option for Elastic Load Balancing that enables traffic distribution in… docs.aws.amazon.com
After those steps above you’ll go back to Athena and you’ve going to have a table that represents the logs in your s3
What’s Next?
After doing all of the above now you can query your logs from S3 using SQL query. Just like the examples in this link:
Querying Application Load Balancer Logs An Application Load Balancer is a load balancing option for Elastic Load Balancing that enables traffic distribution in… docs.aws.amazon.com
BE CAREFUL!
Photo by Pop & Zebra on Unsplash
If you haven’t set up your logs to be structured in a certain way (read about AWS Glue and what is better used for it), then be careful not to have too many logs to query from.
meaning, try not to query from all the logs at the same time if you’ve logged for a couple of months (try to minimize the data size to less than 10GB better), otherwise if it’s around 100GB and you’re querying then it might cost a dollar every 3 query executions, so please be careful and check your logs and the pricing page just in case first.
What to look for in the logs
You’re going to have a lot of values in the logs, but what interests us in our case scenario is the difference between our backend (ex. php/asp.net), nginx/apache/.., Linux server, and load balancer response times. Which are highlighted below from the link above that has the schema.
-time string,
-request_processing_time double,
-target_processing_time double,
-response_processing_time double,
-request_creation_time string,
Read more about those fields here, under syntax. —
Conclusion
As you can see above, those fields mentioned last should give the developer a very good idea of where to look for his performance issue.
I hope this article helped you debug better.
Thanks for reading :)